Monitoring Consumer Groups
How to monitor your consumer groups.
Most open source Kafka deployments use external tooling to monitor consumer group lag. Some of this tooling is compatible with WarpStream because it uses the public Kafka API, and others like Burrow are incompatible because they rely on internal implementation details of Kafka like reading the internal consumer group offset topics.
Luckily, WarpStream has support for monitoring consumer groups built in, so no external tooling is required. In addition, WarpStream reports consumer group lag measured in time as well as measured in offsets. See our blog post about measuring consumer lag in time for more details about why this is valuable.
Consumer group metadata and lag is available in a variety of locations with WarpStream.
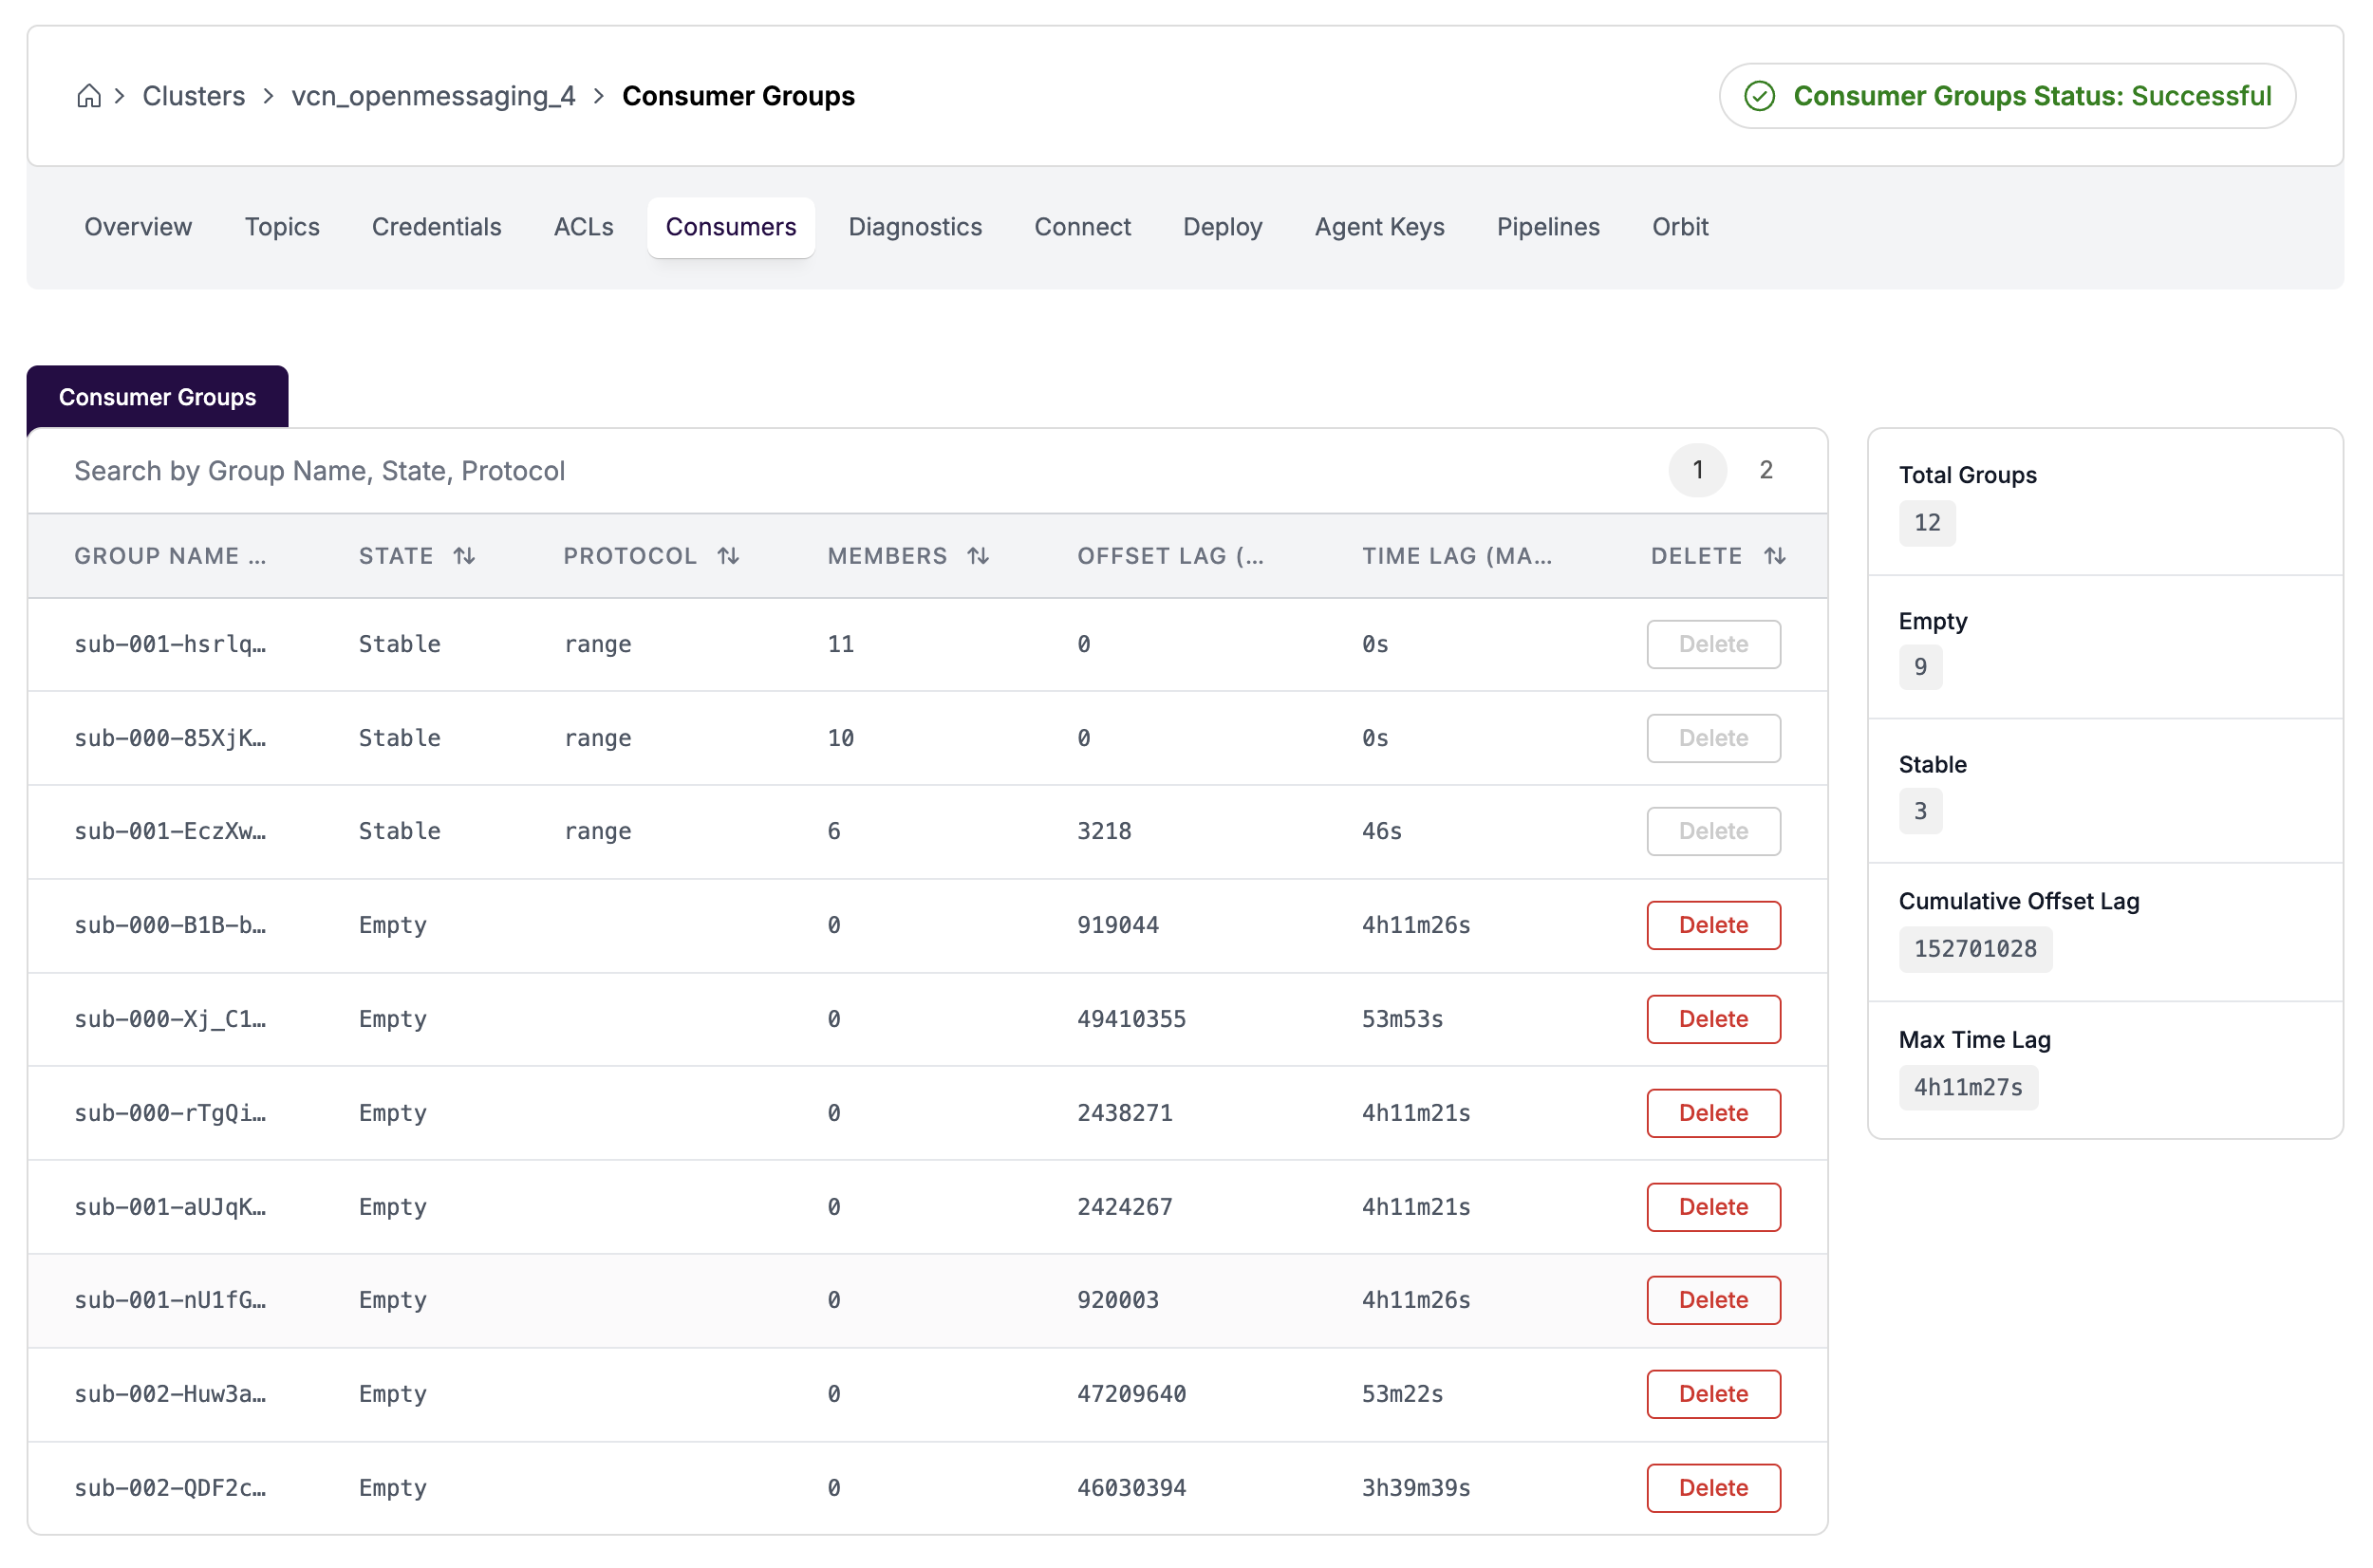
UI
The WarpStream UI exposes consumer group metadata and lag. This is not useful for alerting purposes, but can be helpful when debugging consumers.

API
Consumer group lag is available via our HTTP/JSON API.
Metrics
The Agents expose built-in metrics that you can scrape within your own environment. Included in these metrics are all the metrics you need to monitor your applications for consumer group lag.
Some of the metrics, particularly the consumer group metrics, can become very high cardinality if the cluster contains a lot of topics or partitions. To reduce the cardinality of the consumer group lag metrics, you can either disable them entirely using the disableConsumerGroupMetrics
flag or setting WARPSTREAM_DISABLE_CONSUMER_GROUP_METRICS=true
as an environment variable.
The most important metrics are warpstream_consumer_group_lag
(lag in offsets per tuple of <topic, consumer_group>
) and warpstream_consumer_group_estimated_lag_very_coarse_do_not_use_to_measure_e2e_seconds
which is a mouthful but can be used to configure alerts based on time instead of offset count.
warpstream_consumer_group_lag
Difference (in offsets) between the max offset and the committed offset for every active consumer group.
virtual_cluster_id
, topic
, consumer_group
and partition
warpstream_consumer_group_estimated_lag_very_coarse_do_not_use_to_measure_e2e_seconds
Gives a rough estimate of how far behind (in seconds) a consumer group is from the latest messages.
Note: This is NOT for precise measurement; it's a coarse estimate.
virtual_cluster_id
, topic
, consumer_group
and partition
warpstream_consumer_group_generation_id
A unique identifier that increases with every consumer group rebalance. This allows you to easily track the number and frequency of rebalances.
virtual_cluster_id
and consumer_group
warpstream_consumer_group_max_offset
Max offset of a given topic-partition for every topic-partition in every consumer group.
virtual_cluster_id
, topic
, consumer_group
and partition
warpstream_consumer_group_state
State of each consumer group (stable, rebalancing, empty, etc)
consumer_group
, group_state
warpstream_consumer_group_num_members
Number of members in each consumer group.
consumer_group
warpstream_consumer_group_num_topics
Number of topics in each consumer group.
consumer_group
warpstream_consumer_group_num_partitions
Number of partitions in each consumer group.
consumer_group
Measuring E2E Latency More Accurately
As suggested by its name, the warpstream_consumer_group_estimated_lag_very_coarse_do_not_use_to_measure_e2e_seconds
metric is coarse. For example, if the actual end-to-end (E2E) latency of an application is 800ms, this metric may report the E2E latency as high as 5-8s.
For most applications, this is sufficiently accurate for monitoring and alerting purposes, but some applications may require more fine-grained observability. In that case, the best approach is to monitor the E2E latency manually in your application.
This can be accomplished by emitting a metric for the delta between the current timestamp and the timestamp of each individual record in your application.
There are three different ways that you can assign a timestamp to individual records when they're produced so that they're available to your consumer application:
Every Kafka record has a built-in timestamp. If your application doesn't specifically override this value, then it will automatically be set to the current time by the producer client when the record was produced, or to the current time of the broker when the record was written to disk. Which value is used depends on the configured value of
message.timestamp.type
on your cluster / topic.You can add a custom header to your Kafka records with the current timestamp when producing records.
You can add a custom field in the payload of your Kafka records with the current timestamp when producing records.
Last updated
Was this helpful?